F-correlation
By using utils.f_correlation, which implements the F-correlation [1], we can compute the nonlinear correlation between two variables.
References
Import and settings
import numpy as np
import matplotlib.pyplot as plt
from lingam.utils import f_correlation
Test data
def linear_data(n, r):
    a = np.random.randn(n)
    e1 = np.random.randn(n)
    e2 = np.random.randn(n)
    if r < 0:
        r = -r
        x = -np.sqrt(r)*a - np.sqrt(1-r)*e1
    else:
        x = np.sqrt(r)*a + np.sqrt(1-r)*e1
    y = np.sqrt(r)*a + np.sqrt(1-r)*e2
    return x, y

def x2_data(n):
    x = np.random.uniform(-5, 5, n)
    e = np.random.randn(n)
    y = 0.5 * (x ** 2) + e
    return x, y

def sin_data(n):
    e = np.random.randn(n)
    x = np.random.uniform(-5, 5, n)
    y = 5 * np.sin(x) + e
    return x, y
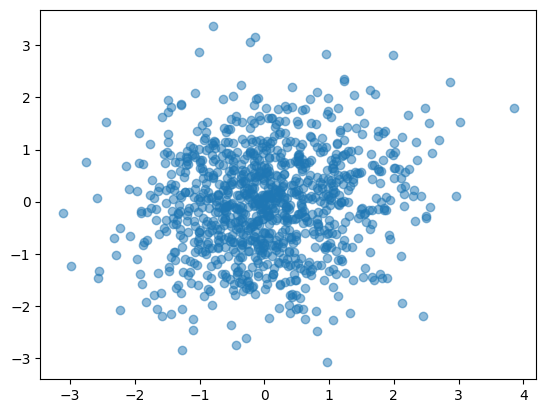
Linear correlated data (Uncorrelated)
x, y = linear_data(1000, 0.1)
corr = np.corrcoef(x, y)[0, 1]
print(f"Pearson's correlation coefficient= {corr:.3f}")

corr = f_correlation(x, y)
print(f'F-correlation= {corr:.3f}')

plt.scatter(x, y, alpha=0.5)
plt.show()
Pearson's correlation coefficient= 0.126
F-correlation= 0.120
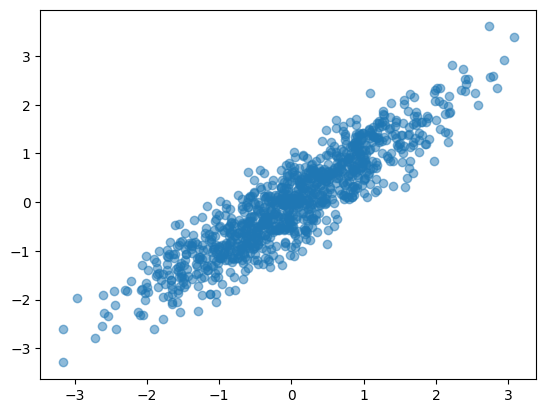
Linear correlated data (Strongly correlated)
x, y = linear_data(1000, 0.9)
corr = np.corrcoef(x, y)[0, 1]
print(f"Pearson's correlation coefficient= {corr:.3f}")

corr = f_correlation(x, y)
print(f'F-correlation= {corr:.3f}')

plt.scatter(x, y, alpha=0.5)
plt.show()
Pearson's correlation coefficient= 0.907
F-correlation= 0.814
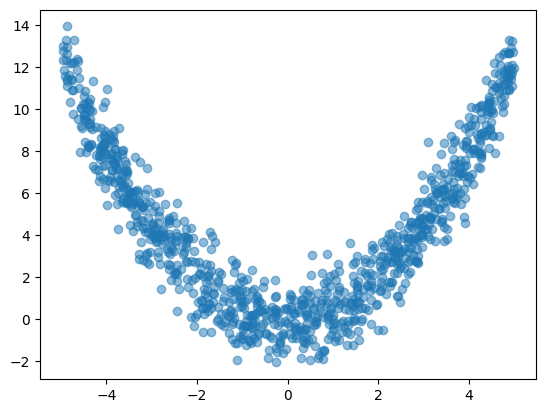
Non-linear correlated data (Quadratic function)
x, y = x2_data(1000)
corr = np.corrcoef(x, y)[0, 1]
print(f"Pearson's correlation coefficient= {corr:.3f}")

corr = f_correlation(x, y)
print(f'F-correlation= {corr:.3f}')

plt.scatter(x, y, alpha=0.5)
plt.show()


Pearson's correlation coefficient= 0.037
F-correlation= 0.848
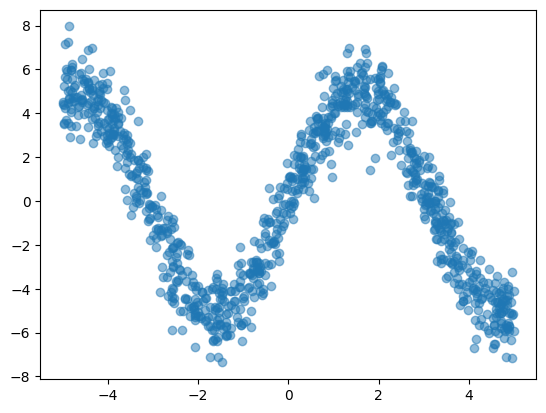
Non-linear correlated data (Sin function)
x, y = sin_data(1000)
corr = np.corrcoef(x, y)[0, 1]
print(f"Pearson's correlation coefficient= {corr:.3f}")

corr = f_correlation(x, y)
print(f'F-correlation= {corr:.3f}')

plt.scatter(x, y, alpha=0.5)
plt.show()
Pearson's correlation coefficient= -0.275
F-correlation= 0.853